Don Brown
September 16th, 2022
The DORA metrics backstory


DORA metrics are becoming the industry standard for measuring engineering efficiency, but where did they come from?
We talk a lot about DORA metrics here at Sleuth — what they are and how to measure them. But we haven’t shared much about the context of DORA metrics — their history and why we use them. So let’s do that. This article provides a summary. Watch the video below to get more details and commentary from Sleuth's CTO, Don Brown, in episode 1 of Sleuth TV Live:
How it began
DORA metrics started with a question and a hypothesis among a small group of people.
Question: What makes the best-performing software engineering teams work (i.e., teams that are best able to deliver on business goals)?
Hypothesis: How a team delivers software has a direct correlation to how well that team achieves its business goals.
So, they formed a startup — DevOps Research and Assessment (DORA) — to dig into it.
The DORA group started surveying people in different companies that were doing DevOps — bringing together development and operations teams — and tracked how they were progressing through that process.
The goal was to understand the best practices and outcomes of DevOps, and they published their findings in the first State of DevOps Report in 2014. (They also published the bookAccelerate: The Science of Lean Software and DevOps, which explains the DORA metrics and methodology behind their study.)
The team determined that four metrics — which came to be known as the DORA, or Accelerate, metrics — strongly correlate to engineering performance, specifically toward achieving organizational goals:
- Deployment Frequency: Measures how often you deploy to production
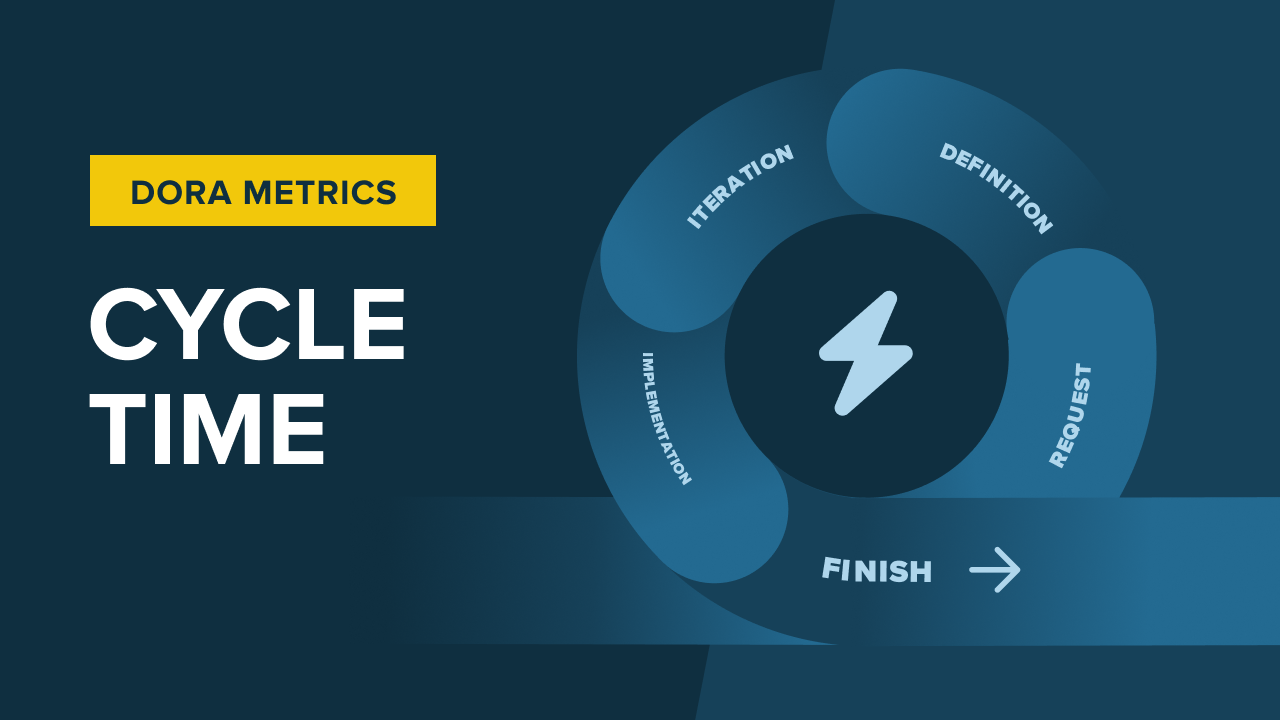
- Change Lead Time: Measures how long it takes to deploy to production
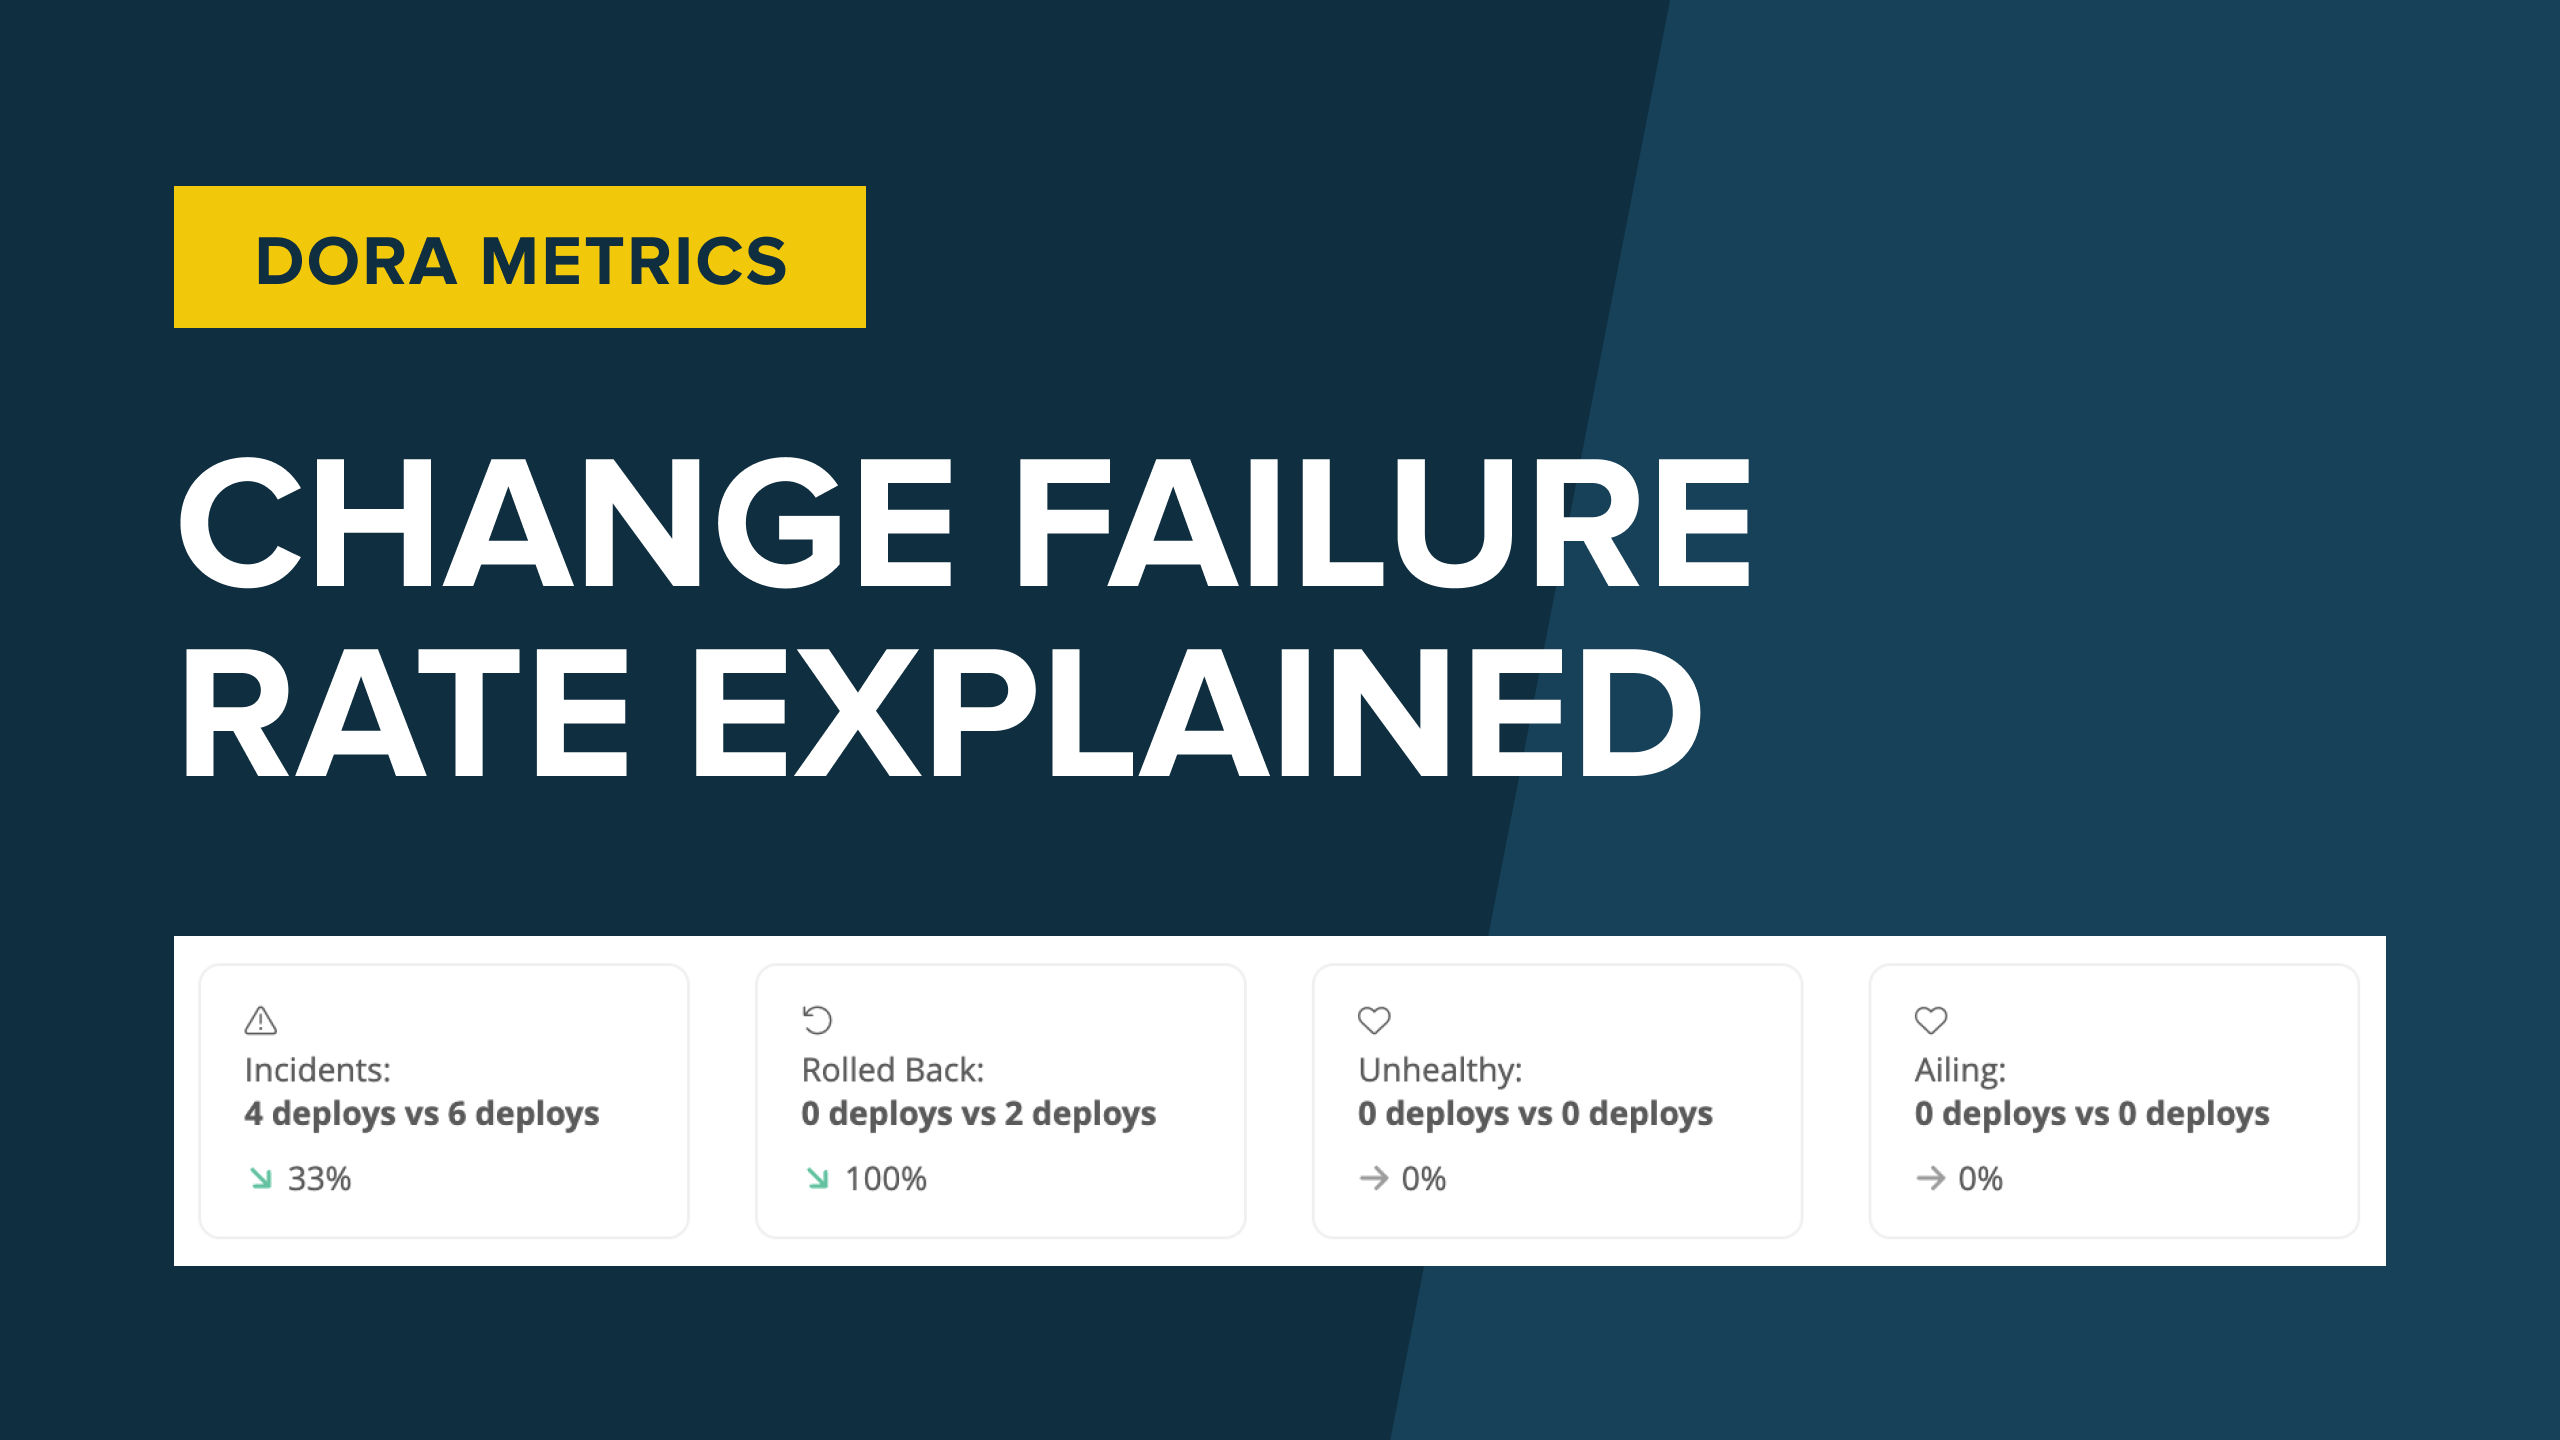
- Change Failure Rate: Measures what percentage of changes to production fail
- Mean Time to Recovery: Measures how long it takes to restore service after a failure
Then, they put categories around the metrics and found that there are four classifications of teams — elite, high, medium, and low — based on how they score in the four metrics. For example, the 2014 report stated that high-performance teams deployed to production 30 times more frequently with 50% fewer failures than low-performance teams.1
Another key finding was that trunk-based development specifically correlated highly with these metrics and with high performing teams. In fact, in just two months of adopting trunk based development, they found that teams saw a 20x improvement in release frequency with zero increase in incidents.2
Finally, solving an industry problem
The problem of how to measure software engineering and what constitutes good engineering practices has received a lot of attention over time. Everyone wants to be able to put numbers on performance. And even though engineering is numbers driven, it's also the field with the fewest metrics.
Sales, support, finance — these teams have plenty of metrics. But not so much with engineering, partly because past efforts to measure developers have focused on the wrong things, like lines of code, number of commits, tickets resolved, etc. These dubious “metrics” bred micromanagement and distrust among developers.
What makes DORA unique is finally, we're able to put hard numbers to something with science to back it up. This isn't just guessing at what’s important to measure, but instead showing that a team is delivering at the highest levels that have been proven to correspond to teams that are also on the highest levels.
Not a silver bullet
A word of caution: DORA metrics are not the only four metrics you should ever care about.
As with any solution, there’s potential to take them too far, and it’s important to remember there are no silver bullets. If you don't have the problems DORA metrics are trying to solve, then they may not be that valuable to you.
You have to go beyond just the metrics themselves and think about how they apply or don’t apply to different aspects or problems you're facing.
Take a simple example of how long it takes to deploy to staging, where code actually changes and ships to customers. From DORA’s standpoint of the metrics as defined in the Accelerate book, a change is whenever your code ships to production, but actually it can be much more than that because there are other types of changes.
At Sleuth, using our own tool, we track deployment frequency, code changes, and we also track feature flag changes, because if you turn on a major feature for one or multiple customers, that's a deployment.
There are also changes created by an operations team. Maybe they're pushing a change out to production, or clearing the database, or deleting a cache. These are all changes that can cause an incident that's worth measuring and would give you a more complete understanding of what's all changing, particularly as your team grows.
Always room for improvement
Something to think about is at what point do your metrics give you enough information? Maybe a survey gives you all the information you need. Or, maybe you want to be more accurate and understand the numbers behind the metrics, and using a tool like Sleuth is important for keys. There's other ways as well. As much time as you want to spend on these metrics, you can get better and more accurate results out of them.
Final thoughts
It's important to understand where DORA metrics come from and what they're trying to solve to see if they make sense for you. The DORA team was looking at how the best teams work, and they discovered trunk based development was key.
And then they asked, “How do you measure that?” They discovered four metrics that strongly correlate to high performing teams, and also that teams that deployed more frequently in smaller batches actually had better experiences and better outputs at the end of the day.
All in all, DORA metrics can really help you take your engineering efficiency to the next level because they get you to start measuring. If you want to improve something, your first step is to measure it. Your second step is to make a change, and then you measure it again. And you repeat that cycle. The faster you repeat that cycle, the more lessons you learn, the more things you improve.
The next questions you likely have are:
- Now that I measured, what changes should I make?
- What lessons can I pull from this?
- How can I use DORA metrics to make my team better?
Get some answers in our next article and video on how to use DORA metrics, including:
- How to use DORA metrics
- How not to use DORA metrics
- Can DORA metrics be useful if you’re deploying every three months? Ten times a day?
- What things are DORA metrics not useful for?
1 Puppet Labs, 2014 State of DevOps Report
2 Jez Humble, DORA’s Journey: An Exploration, Feb. 2019