This post is the third in a series of deeper dive articles discussing DORA metrics. In previous articles, we looked at:
- Deployment Frequency, which tracks how often code is deployed to end users.
- Change Lead Time, which tracks the time from when a developer starts writing code for a feature or a change to when that change is released to end users.
The third metric we’ll examine, Change Failure Rate, is a lagging indicator that helps teams and organizations understand the quality of software that has been shipped, providing guidance on what the team can do to improve in the future.
What is Change Failure Rate?
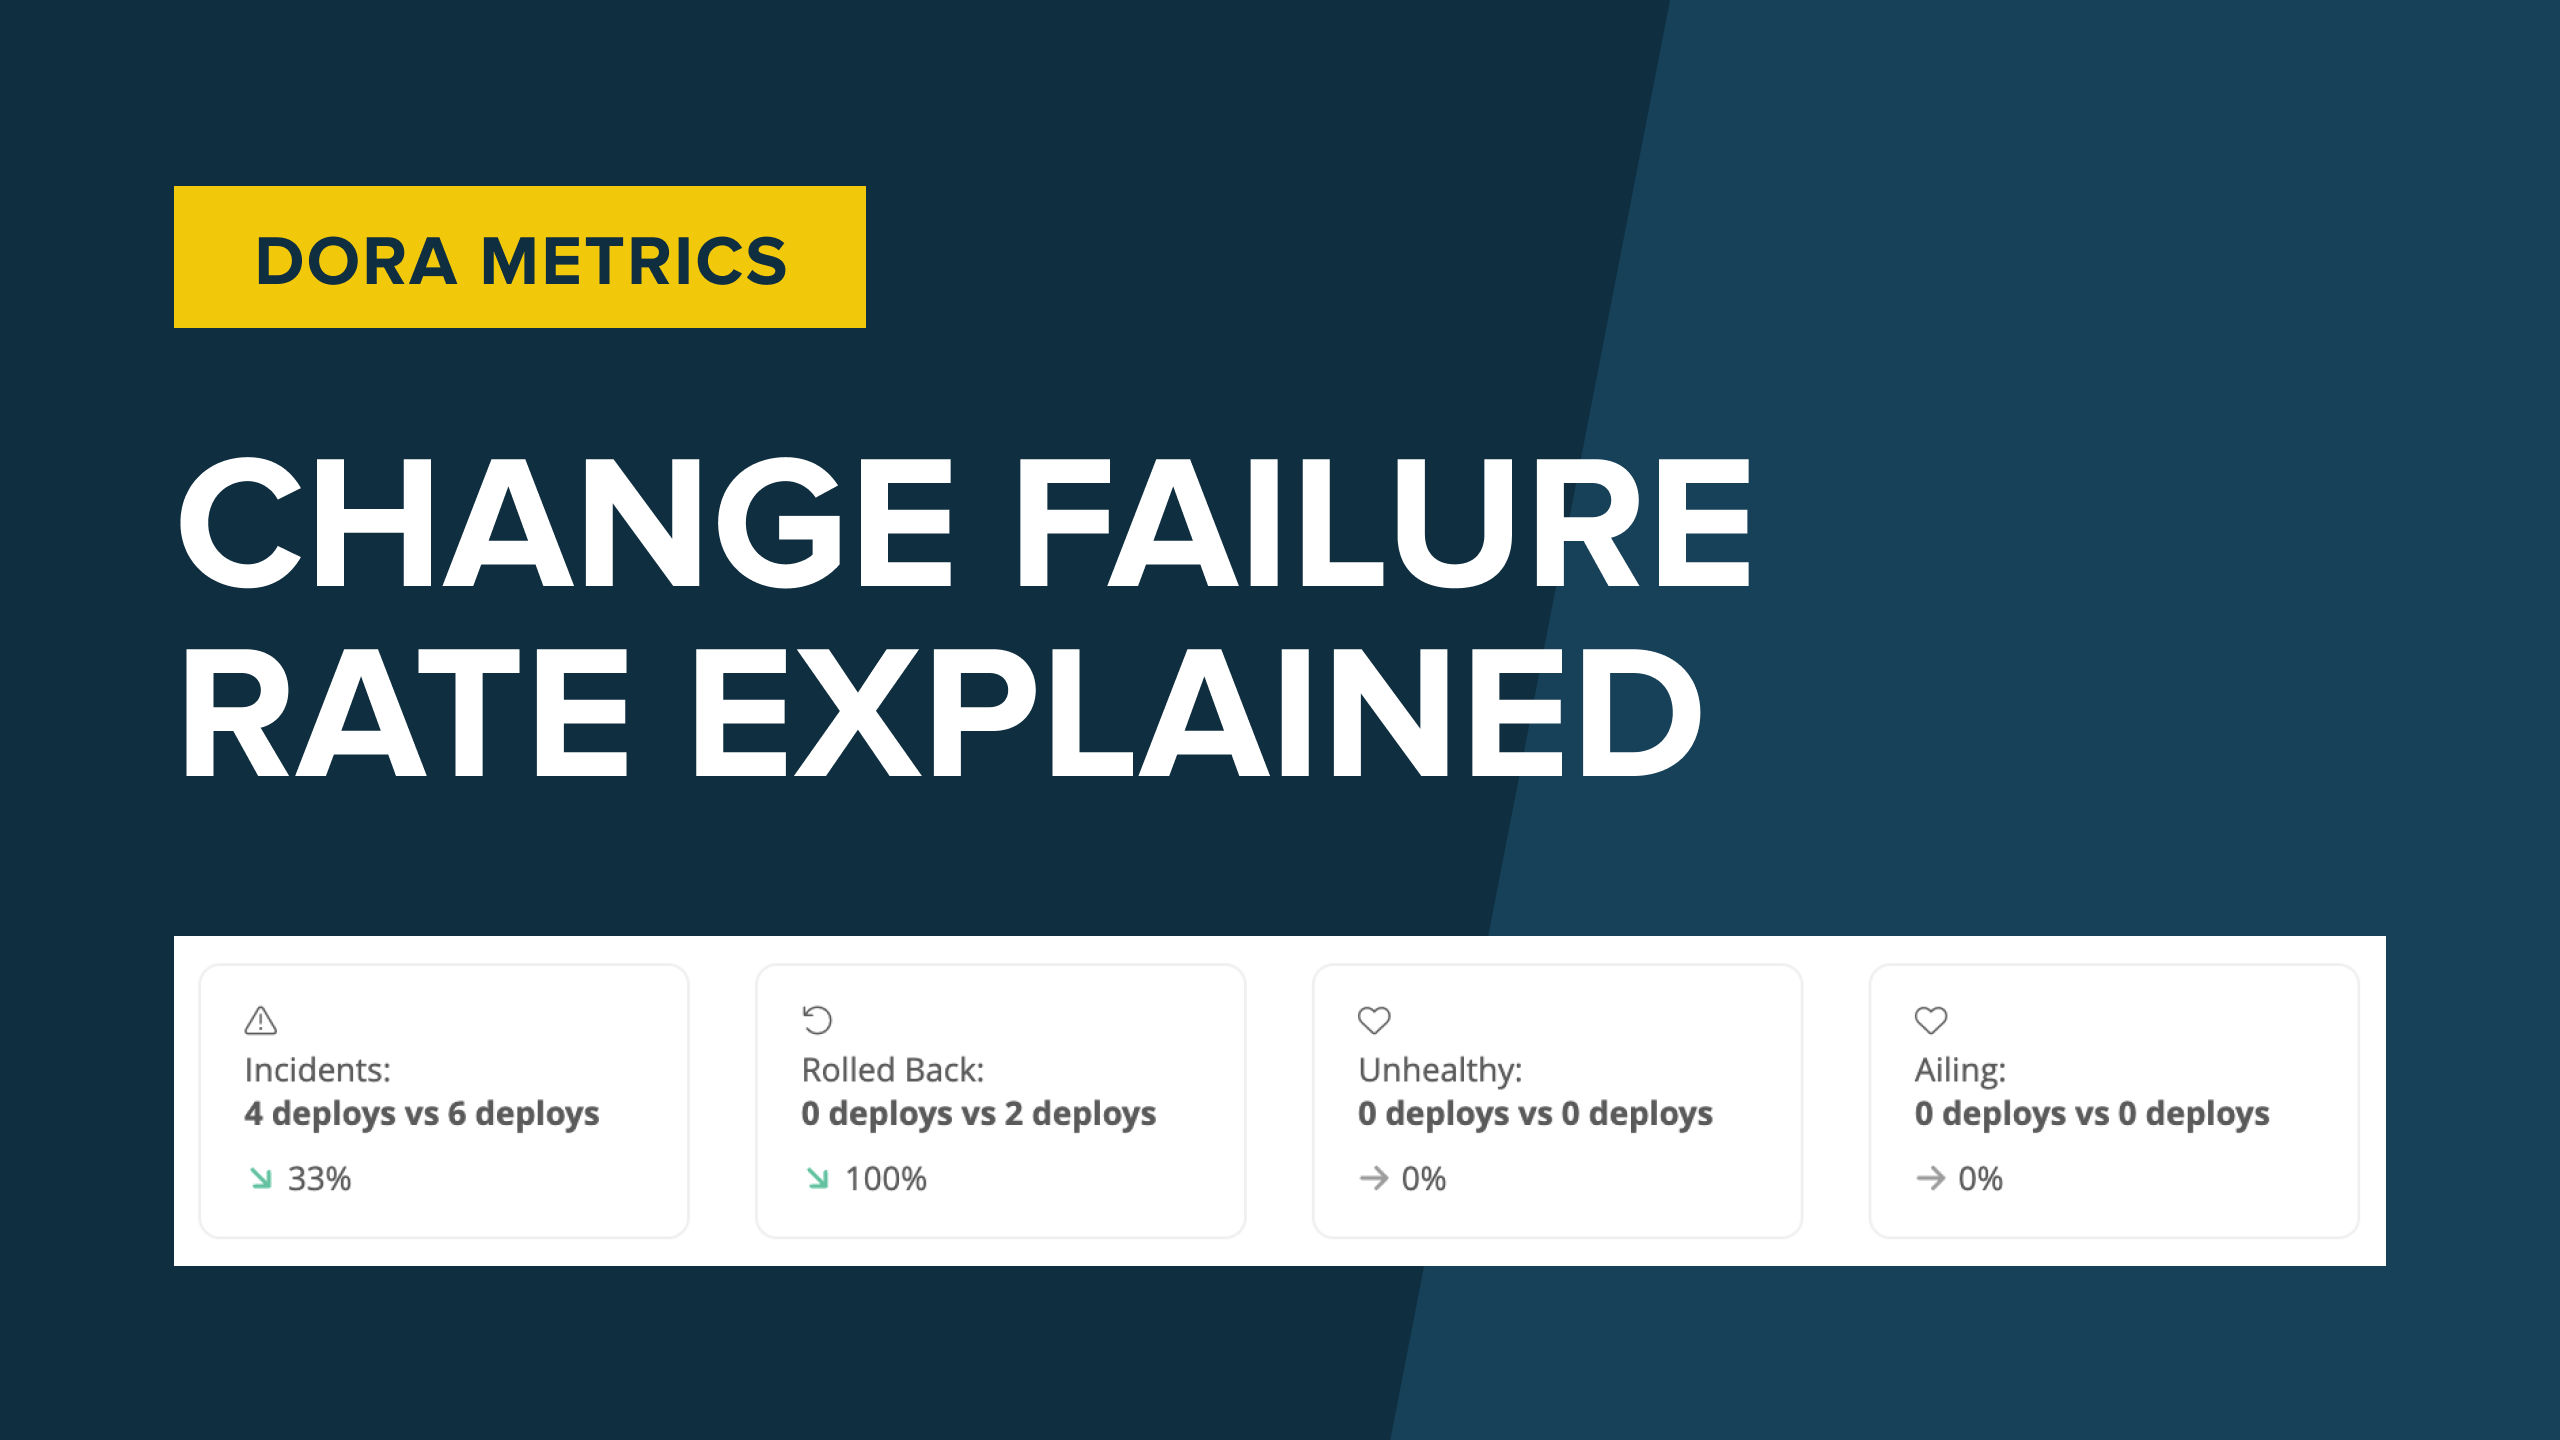
At a high level, Change Failure Rate tracks errors or issues that cause problems for customers after a deployment to production. Change Failure Rate is calculated as a ratio of the number of deployments that caused a failure to the total number of deployments. Like all DORA metrics, Change Failure Rate is a measure of maturity and quality for teams and organizations.
What qualifies as a deployment failure?
The term “failure” can be quite broad, making it challenging to know what kinds of events should be counted against your Change Failure Rate. At Sleuth, we would qualify any of the following events as a failure:
- The team releases a change which then needs to be reverted, resulting in a deployment rollback.
- An incident has occurred, which has caused application downtime or unavailability.
- An automated smoke test, which is set to run periodically on the production build, fails.
- An anomaly detection tool is triggered or a threshold for health checking is exceeded.
For more information on how to define failure, you can watch our explanation video on Sleuth TV.
Potential causes of failure
Deployments that lead to a failure might be the result of bugs in the software, but they could also consist of configuration issues, permission issues, or untracked dependencies on other systems. When a failure occurs, it may not be a complete outage; in some cases, a failure may result in performance degradation. In other cases, a service may be offline, breaking a part of the user’s journey.
Tracking failure
Regardless of the failure’s cause—or the impact—it is crucial to track the occurrence along with the solution that restores service. In modern systems, this may be as simple as redirecting traffic. Teams that employ a rolling deployment strategy can quickly roll back any nodes with the breaking changes. When a misconfiguration or permission issue caused the failure, it may be faster to issue a fix for the missed item. Many organizations will determine solutions on a case-by-case basis, depending on the risk, impact, and urgency of the failure.
A team that seeks to mature and improve its quality of service ultimately needs to decrease the number of deployments that result in failures. Let’s first consider healthy ways to improve this metric, after which we’ll look at some of the do’s and don’ts of dealing with this Change Failure Rate.
How do you improve Change Failure Rate?
There are several measures you can take to improve your Change Failure Rate. Some can be implemented during development, with a focus on testing and automation. Other measures involve the deployment stage, and they include using infrastructure as code, deployment strategies, and feature flags.
Improved testing
When code quality is improved, the risk of code failures is reduced. One of the best ways to improve code quality is to improve your testing practice. This involves testing your application code at every level. The lowest level of testing is the unit test—validating that individual methods or components work as expected.
The next type of test is the integration test, which validates how multiple parts of the system work together. There are debates as to whether integration tests should rely on upstream systems (such as a running database) or if those systems should be mocked. The former may run a test in an environment closer to the production deployment, but the latter can provide more control to force specific failure scenarios.
You can also conduct an end-to-end test, which replicates user behavior in a fully functional environment. These tests validate entire workflows and are typically used either before code is considered ready to deploy, as part of regression testing after a deployment occurs, or both. The downside of end-to-end tests is that they can be hard to create and maintain. This has led to the creation of the test pyramid, or a visual representation of the layers of tests, their speed and complexity, and how much testing you should have at each level. What is considered sufficient test coverage varies from team to team.
Automated testing
The second way to improve code quality is through test automation—the mechanism by which tests are executed. Developers use the results to understand where to focus.
For smaller systems, the entire suite of tests may be executed automatically at specific moments—for example, as part of the continuous integration (CI) pipeline when code is committed, when a pull request is opened, and when code is merged to the main branch. By automating testing so that they’re triggered in certain scenarios, your team can ensure that the running of tests is never forgotten, nor is it dependent on manual intervention from any specific team member.
For larger systems, different tests may be run at specific times. For example, unit tests may run as part of local development and when code is pushed to a repository. Meanwhile, integration tests are run for pull requests, and end-to-end tests are run after deployment. When automating end-to-end testing, which for web applications often involves interactions with the browser, automated browser testing is often used. Fine-tuning when and which tests are run is a team decision, often a function of the size of the codebase and the amount of time it takes to run tests.
Test results should be easily accessible, and any failure should act as a blocker, prohibiting the code/deployment from progressing until the tests pass.
Infrastructure as code
Infrastructure misconfiguration is a common cause of post-deployment failures. Infrastructure as code (IaC) is the capturing of all infrastructure setup and configurations into a declarative format which itself is under version control. Teams that don’t use IaC are setting up their infrastructure manually, and this creates several risks:
- Forgotten or incorrectly applied configurations lead to inconsistencies from one deployment to the next. Incorrectly configured environments can lead to deployment failures, negatively affecting a team’s Change Failure Rate.
- As engineers make manual changes to infrastructure over time, configuration drift occurs. If the infrastructure reaches a configuration state that breaks a deployment, there’s no definitive way to “roll back” your infrastructure configuration.
- Manual configuration likely depends on a specific team member: Bob. When it comes to spinning up infrastructure, everybody on the team depends on Bob. Bob knows the configurations for every infrastructure resource across the entire application. Bob is awesome. Bob is also not allowed to take PTO, resign, retire, or die.
IaC tools for configuration management include Puppet, Chef, Ansible, and Terraform, AWS CloudFormation, and Pulumi. They all provide functionality for developers to declare what the expected state of an environment is and address any gaps identified.
A mature team automates the IaC flow and makes it a part of the deployment workflow when new code is released. For teams that want to decrease production failures due to misconfigured environments, IaC is incredibly important.
Deployment strategies
When teams use a deployment strategy instead of an ad hoc deployment process, they lower the risk of failed deployments and improve their Change Failure Rate.
Let’s consider the basic example of a team preparing to release a new version of its code. The team schedules an outage, takes down the system, ensures that the new version is released and validated, and finally restores access to customers. The downside to this approach is that it is incredibly risky. Any little hiccup requires a rollback, patch, hotfix, or fix forward (fixing the issue in place on the production deployment) as there is no other way for end users to regain access.
The high level of risk associated with ad hoc deployments has led many teams to adopt a deployment strategy. Three commonly used strategies are canary deployments, blue-green deployments, and rolling deployments.
Canary deployments
In a canary deployment, the updated version of an application is only released to a small subset of users. When an application is available and accessible across several nodes, a load balancer is used to route a small percentage of users to a single node with the new code. That node is actively monitored to track performance and ensure that there were no regressions. If failures are detected, then the team is at least assured that only a small percentage of users encountered the error, and the load balancer can be reverted to route all users to the original version. Once the team has confidence that the canary deployment is error-free, then the new version can be rolled out gradually to additional users (with a “rolling deployment” strategy—see below) or immediately made available for all users.
Blue-green deployments
In a blue-green deployment, a staging environment and a production environment run live at the same time. New code is released to the staging environment, and tests are performed. When the release is ready, the staging environment is promoted to production and receives all of the live traffic. Running two separate deployments gives you the space to validate application updates before switching over to make them live. This approach reduces risk before deployment.
The old production environment becomes the new staging environment, but it continues to be available for a quick switchover (which functions like a rollback) in case the newly released deployment fails.
Rolling deployments
With the rolling deployment strategy, individual nodes/containers/VMs are replaced one at a time. Let’s take the example of an application available across four different nodes. In a rolling deployment, a single node would be taken out of service by the load balancer, updated with the new version of code, tested in isolation, and then put back into rotation.
Feature flags
Change Failure Rate can also be improved through the use of feature flags, which are a way to disconnect deployments from releases. Instead of relying on deployments as a mechanism for users to try new features, they are hidden behind flags. These flags are evaluated at runtime and route a user to different parts of the codebase depending on their value. For example, a team may create a new login screen to replace the old one. Both screens exist in the codebase, but which one is seen by users depends on the value of a feature flag, which could even be set on a per-user basis. This way, perhaps only a few specific internal users, beta testers, or early adopters have access to the new screen via the feature flag. In this sense, feature flags have some similarities to a canary release deployment strategy.
If any users have issues, it is simply a matter of toggling the feature flag rather than deploying or rolling back code. Over time, the feature flag can be toggled on for more and more users until, eventually, all users can access the new feature.
The dos and don’ts of Change Failure Rate
Throughout our series, we’ve repeatedly stressed that all of the DORA metrics need to be considered together. Gaming the system to improve one specific metric will be evident once other metrics subsequently worsen. With that in mind, let’s look at some of the dos and don’ts of Change Failure Rate.
Do: Automate testing and infrastructure provisioning. Today’s applications are too complex, both in their codebase and in the infrastructure resources required to run them. It’s untenable for any team or team member to try to keep track of all the tests that need to be performed or all of the configurations that need to be put in place. Manual testing and manual infrastructure provisioning are error-prone and inconsistent. Teams will reduce the number of deployment failures if they ensure that their testing and provisioning processes are carried out the same way every time.
Don't: Reduce deployment failures by reducing deployments. The immature team says, “If you don’t try, you won’t fail.” Because Change Failure Rate keeps track of the number of failed deployments, teams may deploy less to avoid failure. However, your Deployment Frequency metric will certainly take a hit.
In addition, if you deploy less frequently, then the number of proposed changes will build up over time, leading to a large body of changes taking place when you finally deploy. More changes mean more ways for your application to fail and greater impact when it does fail. Rather than reducing total deployments, work to find the root cause of failed deployments and address those causes instead.
Do: Involve developers in production deployments. On large teams, application code developers may be completely distanced from the production deployment process performed by other team members. With this separation, the connection between developer practices and failed deployments is not always clear. To a developer, a failed deployment is always “their problem” until you can pinpoint an actual bug in the developer’s code. By involving developers in deployments, they can see the connection between their changes and failures.
Don't: Overlook important information associated with Change Failure Rate. At its most basic, Change Failure Rate captures the number of failed deployments relative to the total number of deployments. However, there are other pieces of information that teams have access to but may overlook:
- The duration of the outage or service degradation when a failure occurs
- The solution used to restore service
Not all deployment failures are equal, even though they count equally against the Change Failure Rate metric. It would be significant to record that “failure A” caused 48 hours of service disruption while “failure B” caused 10 minutes of downtime. Looking at outage duration or impact alongside Change Failure Rate will help a team prioritize its efforts to improve its processes.
By capturing the solutions used to restore service after each deployment failure, a team may gain valuable insights into the root cause of failures. In addition, capturing these solutions and standardizing processes for applying them will help a team improve its Mean Time to Recovery (MTTR).
Conclusion
Teams that aspire to be called elite performers have a variety of tools and approaches at their disposal to help increase quality and confidence while decreasing the number and length of outages. The most mature teams typically have a Change Failure Rate between 0%-15%. To ensure their users aren’t impacted by bugs or misconfigurations, these teams use automated testing, IaC, deployment strategies, and feature flags. A low Change Failure Rate increases customer satisfaction and team morale, enabling teams to focus on improving other DORA metrics and shipping quality code.